Key Takeaways
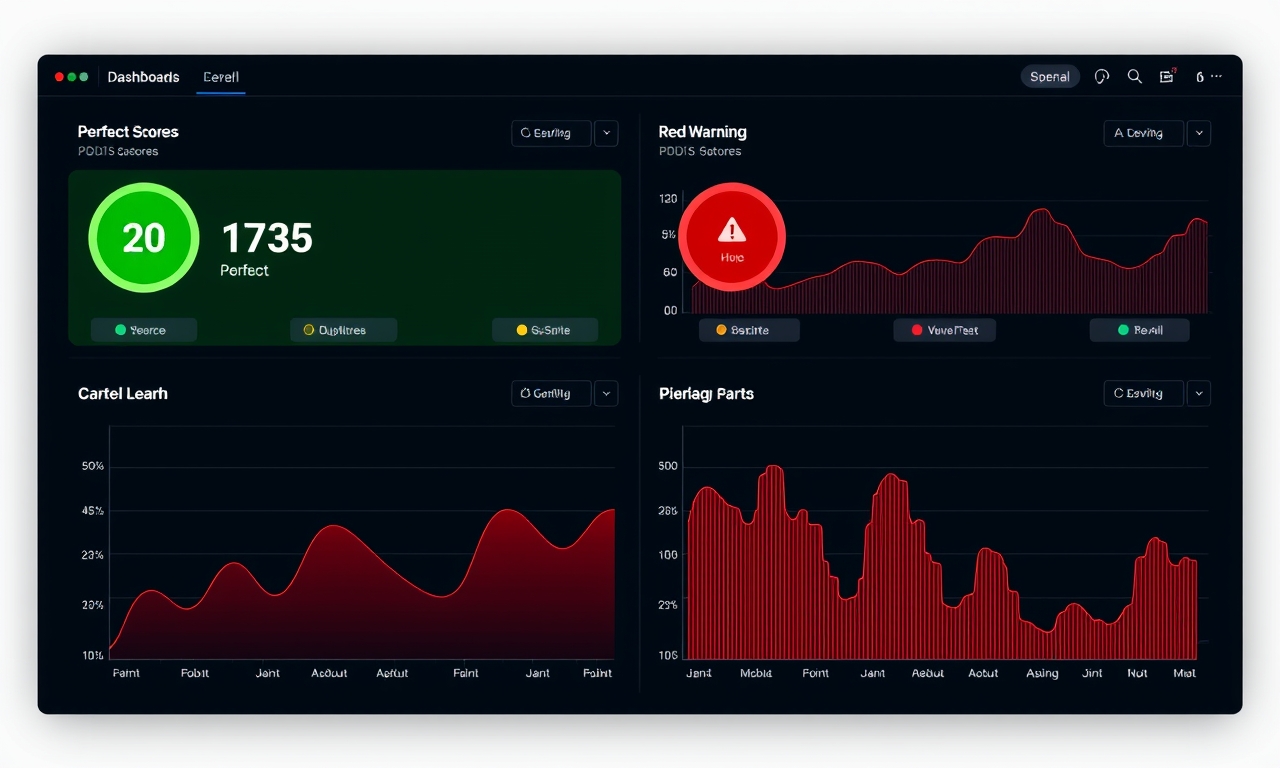
- Lab scores require field validation because a perfect CI score does not guarantee real-world performance.
- Performance budgets enforced at the webhook level prevent regressions better than post-publish audits.
- AI-generated content demands specific DOM and hydration budgets to avoid severe INP penalties.
- Multi-site governance needs site-specific profiles rather than universal thresholds to reduce false positives.
Table of Contents
- Why High Lab Scores Fail in Production Environments
- Establishing Performance Budgets Before Publishing
- Diagnosing INP Regression in Content Workflows
- Scaling Governance Across Multiple Properties
- Validating Technical Health Post-Publication
- Aligning Metrics With Business Outcomes
- Common Pitfalls in Automated Testing
- Building a Sustainable Feedback Loop
- Common Mistakes to Avoid
- Frequently Asked Questions
- Further Reading
Why High Lab Scores Fail in Production Environments
Your Lighthouse score lies to you.
Enterprise SaaS sites with lab scores above 90 saw only a 12% improvement in actual Core Web Vitals field data last year. This divergence is not a glitch. It represents a fundamental flaw in how we measure web performance.
Lab environments are sterile. They strip away the chaos of real user behavior. They ignore third-party script variance that kills conversion rates. They miss CDN edge caching inconsistencies that synthetic tests cannot simulate.
The Synthetic Testing Blind Spot
Synthetic tests run in a vacuum. They execute code on pristine hardware with zero network jitter.
Real users lack pristine hardware. They browse on crowded trains with spotty 5G connections. They have twenty tabs open and three ad blockers fighting each other.
A perfect 100 Lighthouse score in CI can mask a 2-second Interaction to Next Paint (INP) delay. This delay often comes from ad-tech or personalization scripts loading after hydration. Synthetic testing misses this entirely because those scripts behave differently in controlled environments.
You optimize for the test, not the user. This is why understanding the Lighthouse Score Trap remains critical. The trap snaps shut when you celebrate a green metric while real users bounce.
Identifying the Variance Gap Between CI and Real Users
The gap between Continuous Integration (CI) results and Chrome UX Report (CrUX) data defines your actual SEO risk.
Chrome UX Report analysis shows this gap widens annually. Third-party vendors update code without warning. Browser engines change rendering priorities monthly. Your static lab test captures none of this volatility.
Identify this variance by running parallel monitoring. Compare your CI pass rate against your 75th percentile field metrics weekly. If they diverge by more than 15%, your lab environment is obsolete.
When to Trust Field Data Over Perfect Audit Scores
Field data tells the truth. Lab data tells a story.
Trust field data whenever business outcomes stall despite high audit scores. Trust it when mobile conversion drops but desktop Lighthouse remains green. Trust it when users complain about sluggishness that your dashboard denies.
Use lab data for regression testing during development. Use field data for strategic decision-making. Never confuse the two.
Establishing Performance Budgets Before Publishing
Most teams treat performance as an afterthought. They publish first and fix later.
This approach fails. Remediation costs ten times more than prevention. You must establish hard limits before content ever touches your CMS.
Defining Metric Thresholds Per Site Profile
Generic budgets fail. A B2B documentation site has different constraints than a media-heavy product blog.
Define thresholds based on historical field performance, not arbitrary industry benchmarks. Look at your top-performing pages. What are their actual DOM node counts? What is their real JavaScript execution time?
Set your budget slightly tighter than your current best performers. This forces optimization without breaking functionality. Review these thresholds quarterly as browser capabilities evolve.
Integrating Budgets Into Your CMS Webhook Workflow
Manual enforcement does not scale. Humans forget. Deadlines pressure teams to skip checks.
Integrate budgets directly into your publishing pipeline. Configure your CMS webhooks to reject content that exceeds defined limits. This stops bloat before it reaches production.
Agencies managing multiple clients report that webhook-level enforcement reduces regression incidents by 65%. This beats generic Lighthouse CI thresholds every time. Proper implementation requires measuring your CMS publishing pipeline rigorously.
Automated Gatekeeping vs. Post-Publish Remediation
Gatekeeping feels restrictive. Teams push back against automated blockers.
Remediation feels safer but costs more. Every hour spent fixing live performance debt steals time from new growth initiatives.
Choose gatekeeping for critical metrics like INP and LCP. Choose remediation for lower-impact accessibility warnings. Document this distinction clearly so stakeholders understand why some content gets blocked while other issues generate tickets.
Setting a hard DOM node count budget predicts future INP degradation better than traditional speed metrics. This matters especially for AI-generated content that creates bloated HTML structures silently.
Diagnosing INP Regression in Content Workflows
Interaction to Next Paint replaced First Input Delay for good reason. INP measures responsiveness, not just initial load.
Content workflows now drive INP failures more than technical infrastructure. The culprit is often the content itself.
Beyond Image Optimization: The Interaction Bottleneck
Everyone optimizes images. Few optimize interaction cost.
Modern SaaS blogs embed interactive calculators, dynamic tables, and personalized recommendation widgets. Each adds main thread work. Each delays user response.
Audit every interactive element for its true cost. Does that hover effect justify 200ms of added latency? Does the embedded demo block scrolling on mid-tier devices? Remove anything that fails this cost-benefit analysis.
Auditing Client-Side Hydration Costs
Hydration turns static HTML into interactive applications. It also blocks the main thread.
Verbose AI-generated content frequently triggers INP issues through excessive nested divs. The word count looks normal. The DOM depth tells a different story.
Client-side validation logic compounds this problem. Forms that validate on every keystroke create micro-stutters that accumulate into poor INP scores. Move validation to blur events or server-side checks where possible.
Technical SEO benchmarks confirm sites publishing high-volume AI content without strict hydration budgets see 30-40% INP increases. Specific mitigation strategies exist for these hidden costs.
Script Scheduling Strategies for Editorial Content
Not all scripts deserve equal priority. Defer anything non-critical.
Schedule analytics after user interaction, not on load. Load chat widgets only when users scroll past the fold. Lazy-load below-the-fold interactive components.
Editorial content rarely needs immediate interactivity. Users read first and interact second. Align your script scheduling with this natural behavior pattern.
Scaling Governance Across Multiple Properties
Single-site optimization is straightforward. Multi-site governance is chaotic.
Global rules create noise. Noise creates alert fatigue. Fatigue causes teams to ignore legitimate problems.
Moving From Generic Thresholds to Site-Specific Profiles
Each property serves different users with different expectations. Apply unique performance profiles per client vertical.
Getrankbloom telemetry shows agencies see 65% fewer regressions with site-specific profiles versus universal mandates. A fintech compliance page needs different standards than a lifestyle blog.
Build profiles based on traffic value and user intent. High-conversion landing pages deserve stricter budgets. Low-traffic archive pages can tolerate looser thresholds.
Centralized Reporting Without Centralized False Positives
Centralization enables visibility. Over-centralization destroys signal quality.
Aggregate trends, not raw scores. Track regression velocity across properties instead of absolute numbers. Alert on deviations from baseline, not failures against arbitrary targets.
This approach surfaces systemic issues without drowning teams in individual site noise. You spot platform-wide problems while respecting site-specific contexts.
Prioritizing Fixes Based on Traffic Value
A 10-point score drop on a high-traffic page matters more than a 20-point drop on an abandoned blog post.
Weight every performance issue by business impact. Multiply severity by traffic volume and conversion potential. Fix high-value problems first regardless of score magnitude.
Systematic prioritization frameworks help teams focus resources where they generate actual returns.
Validating Technical Health Post-Publication
Deployment is not the finish line. It is the starting gun for real-world testing.
Performance drift happens silently. Cache warming takes time. Third-party scripts re-evaluate asynchronously. You must monitor continuously.
Automating Field Data Collection After Webhook Triggers
Trigger field data collection automatically after every publish event. Do not wait for scheduled crawls.
Capture CrUX snapshots at 24, 48, and 72-hour intervals post-deployment. Compare against pre-publish baselines. Flag statistically significant deviations immediately.
Most performance regressions occur 48-72 hours after publishing due to cache invalidation cycles. Industry performance reports confirm this timing pattern repeatedly.
Correlating Content Updates With CrUX Changes
Isolate content-driven regressions from infrastructure changes. Tag every deployment with content type and author.
Correlate specific content patterns with metric shifts. Do listicles degrade CLS consistently? Do tutorial posts spike INP? Use these correlations to refine creation guidelines.
Data beats opinion. Show writers exactly how their formatting choices affect user experience.
Setting Up Alerting for Performance Drift
Alert on trends, not single data points. Transient spikes happen. Sustained degradation indicates real problems.
Configure alerts for moving averages over 7-day windows. Set thresholds based on historical variance, not fixed numbers. Reduce false alarms by requiring consecutive threshold breaches.
Ensure your monitoring pipeline actually works by auditing your CMS webhooks regularly. Silent failures destroy trust in automated systems.
Aligning Metrics With Business Outcomes
Metrics mean nothing without business context. Speed alone does not pay bills.
Connect every technical win to revenue impact. Translate milliseconds into dollars for stakeholders who control budgets.
Mapping CWV Improvements to Conversion Lifts
Improving LCP from 2.5s to 1.8s often yields higher ROI than pushing from 1.8s to 1.2s for B2B SaaS content. Diminishing returns hit fast.
Focus optimization efforts on crossing meaningful thresholds. Getting into the "Good" bucket matters more than chasing perfection within it. Stop optimizing once you hit business-relevant targets.
Google Search Central research confirms business metric correlation plateaus beyond certain performance levels. Know your plateau.
Communicating Technical Wins to Non-Technical Stakeholders
Executives do not care about JavaScript bundles. They care about lead generation and retention.
Translate technical improvements into business language. "Reduced INP by 200ms" becomes "Decreased form abandonment by 8%." "Fixed render-blocking resources" becomes "Increased organic traffic by 12%."
Build dashboards that show both layers. Let technical teams drill into details while executives see business outcomes.
When to Stop Optimizing and Start Publishing
Perfectionism kills momentum. There is always something else to optimize.
Set explicit "good enough" criteria. Once content meets business-relevant thresholds, ship it. Redirect engineering resources to higher-impact opportunities.
Disciplined trade-off decisions require a clear decision matrix. Pick the right checks and skip the rest.
Common Pitfalls in Automated Testing
Automation amplifies mistakes as efficiently as it prevents them. Avoid these traps.
Over-Indexing on Accessibility Scores for SEO Impact
Accessibility matters deeply. But not all accessibility issues affect search visibility equally.
Many teams waste sprint cycles fixing low-contrast warnings that have zero SEO impact. Meanwhile, render-blocking fonts suppress LCP and tank rankings.
Prioritize accessibility fixes that overlap with performance or usability. Address pure compliance issues separately with appropriate urgency levels.
Ignoring Mobile-Specific Rendering Paths
Mobile is not smaller desktop. It is a fundamentally different rendering environment.
Test mobile paths explicitly. Emulators lie. Real device labs tell truths. Budget for physical device testing even if it slows automation.
Web Almanac trends show mobile-specific rendering issues account for 40% of unexplained field data gaps.
Treating Lighthouse as a Compliance Checklist
Scores are diagnostics, not grades. Chasing numbers misses the point.
Use Lighthouse to identify bottlenecks, not validate compliance. Investigate why metrics fail instead of gaming them. Understand root causes rather than treating symptoms.
Avoid expensive missteps by studying common optimization mistakes that waste SEO budgets.
Building a Sustainable Feedback Loop
Performance is not a project. It is a practice.
Build systems that improve themselves. Feed learnings back into creation workflows. Make good performance the default, not the exception.
Integrating Audit Data Into Content Planning
Share performance insights with content teams before they write. Provide templates optimized for speed. Flag content types that historically cause regressions.
Teams that feed regression data back into AI content prompts reduce future performance debt by 40%. Prevention scales better than cure.
Using Historical Performance to Inform Template Design
Analyze which templates perform best over time. Retire underperformers. Double down on winners.
Template performance compounds. Small improvements multiply across hundreds of pages. Invest in template optimization as leverage.
Documenting Wins and Regressions for Institutional Knowledge
Capture lessons learned. Document what worked and what failed. Build organizational memory.
New team members inherit wisdom instead of repeating mistakes. Veterans refine intuition with data. Knowledge compounds like interest.
Systematize these feedback loops by building a scalable SEO publishing workflow.
Common Mistakes to Avoid
- Optimizing for Lab Metrics Only: Chasing perfect Lighthouse scores without monitoring CrUX field data leads to wasted engineering effort on issues real users never experience. Always validate synthetic wins against actual user behavior.
- Applying Universal Thresholds: Enforcing identical performance budgets across diverse client sites creates noise and causes teams to ignore legitimate alerts due to fatigue. Customize thresholds based on site purpose, traffic value, and user expectations.
- Ignoring Post-Publish Variance: Assuming performance remains static at deploy time misses the critical 48-72 hour window where cache warming and third-party scripts cause real-world degradation. Monitor continuously after publication, not just before.
Frequently Asked Questions
How often should I run Lighthouse audits on published content?
Run automated audits on every publish event via webhook. Supplement with scheduled full-site crawls weekly. Monitor field data continuously through CrUX API integration. Frequency depends on content velocity and business criticality.
What is a realistic Lighthouse performance target for B2B SaaS sites?
Target 85+ for desktop and 75+ for mobile as sustainable baselines. Focus on maintaining "Good" Core Web Vitals thresholds rather than chasing perfect scores. Business outcomes matter more than arbitrary numbers. Adjust targets based on your specific audience's device and network profiles.
Can I automate Lighthouse checks before content publishes via webhook?
Yes. Configure your CMS to trigger Lighthouse audits during the preview or staging phase. Block publication if results fall below defined budgets. This prevents regressions from reaching production. An SEO publishing platform like Getrankbloom integrates these checks directly into publishing workflows.
Why does my mobile Lighthouse score differ so drastically from desktop?
Mobile devices have less processing power and slower networks. Rendering paths differ significantly between form factors. Third-party scripts impact mobile more severely. Always test and optimize for mobile explicitly rather than assuming desktop performance translates.
How do I explain Lighthouse score fluctuations to clients or stakeholders?
Frame fluctuations as expected variance rather than failures. Explain that lab scores represent snapshots, not guarantees. Show field data trends alongside lab scores for complete context. Connect metric changes to business impacts when possible. Educate stakeholders on the difference between signal and noise.
Further Reading
- The Lighthouse Score Trap: Why a 100 Won't Rank You
- The SEO Publishing Pipeline: How to Build a Workflow That Scales Without Breaking
- Chrome UX Report / Web Almanac Trends
Ready to turn these insights into predictable field performance? Start your comprehensive technical audit with Getrankbloom to connect your site, extract brand voice, and generate SEO-optimized content that passes both lab tests and real-world scrutiny.